Replicate Our Model
Air Partners started in 2017 with the guiding principle of decentering our own objectives related to science and engineering in order to center the priorities of our community partners and their stakeholders. This posture toward our work has led us to a process of continually learning from and with our partners.
Because no two partners have exactly the same priorities, and there is no “one size fits all” solution for stakeholders, all of our projects have taken a unique form. However, in navigating numerous projects in a variety of contexts and with a diverse set of partners, we have developed a generalized approach to community-driven air quality projects that serves as a flexible roadmap for the type of work we do.
We have endeavored to summarize this model in such a way that it can be adapted to a wide variety of contexts, and have included guiding questions at each step that we have found helpful in centering community priorities. As you engage with these materials, please feel free to reach out to us for support. We’d love to learn alongside you.

01
Identify Stakeholder Priorities

02
Plan Project

03
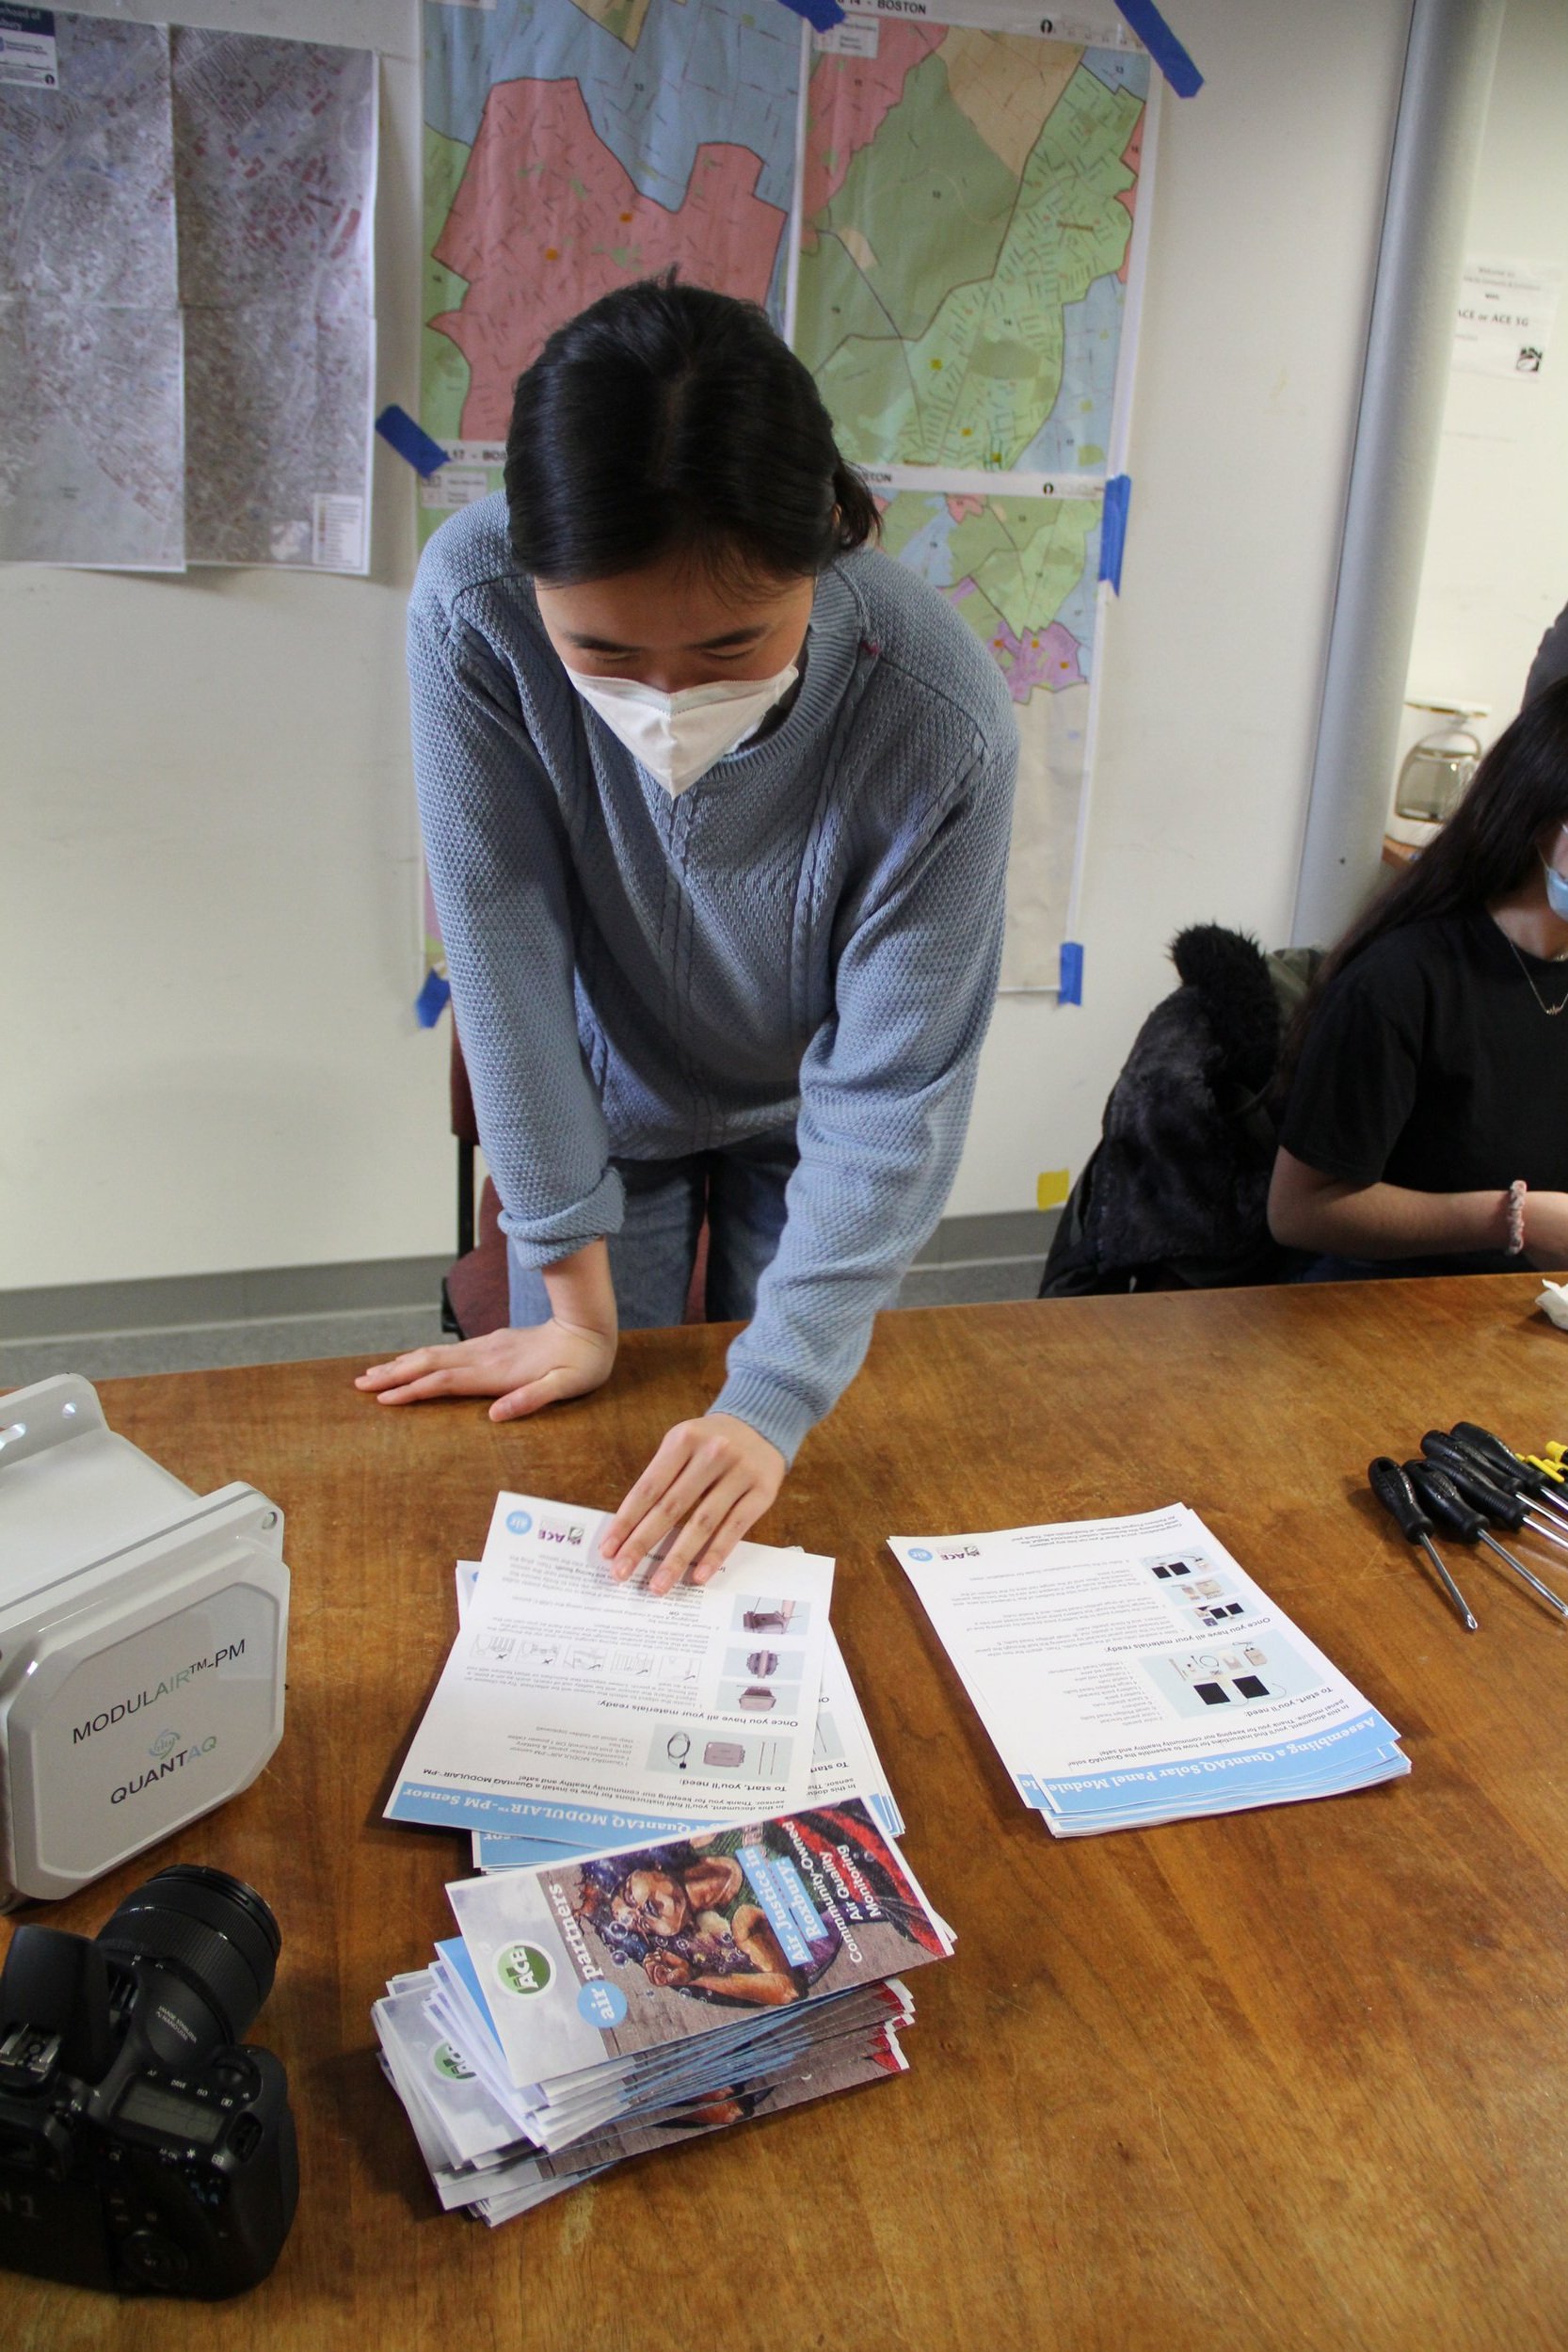
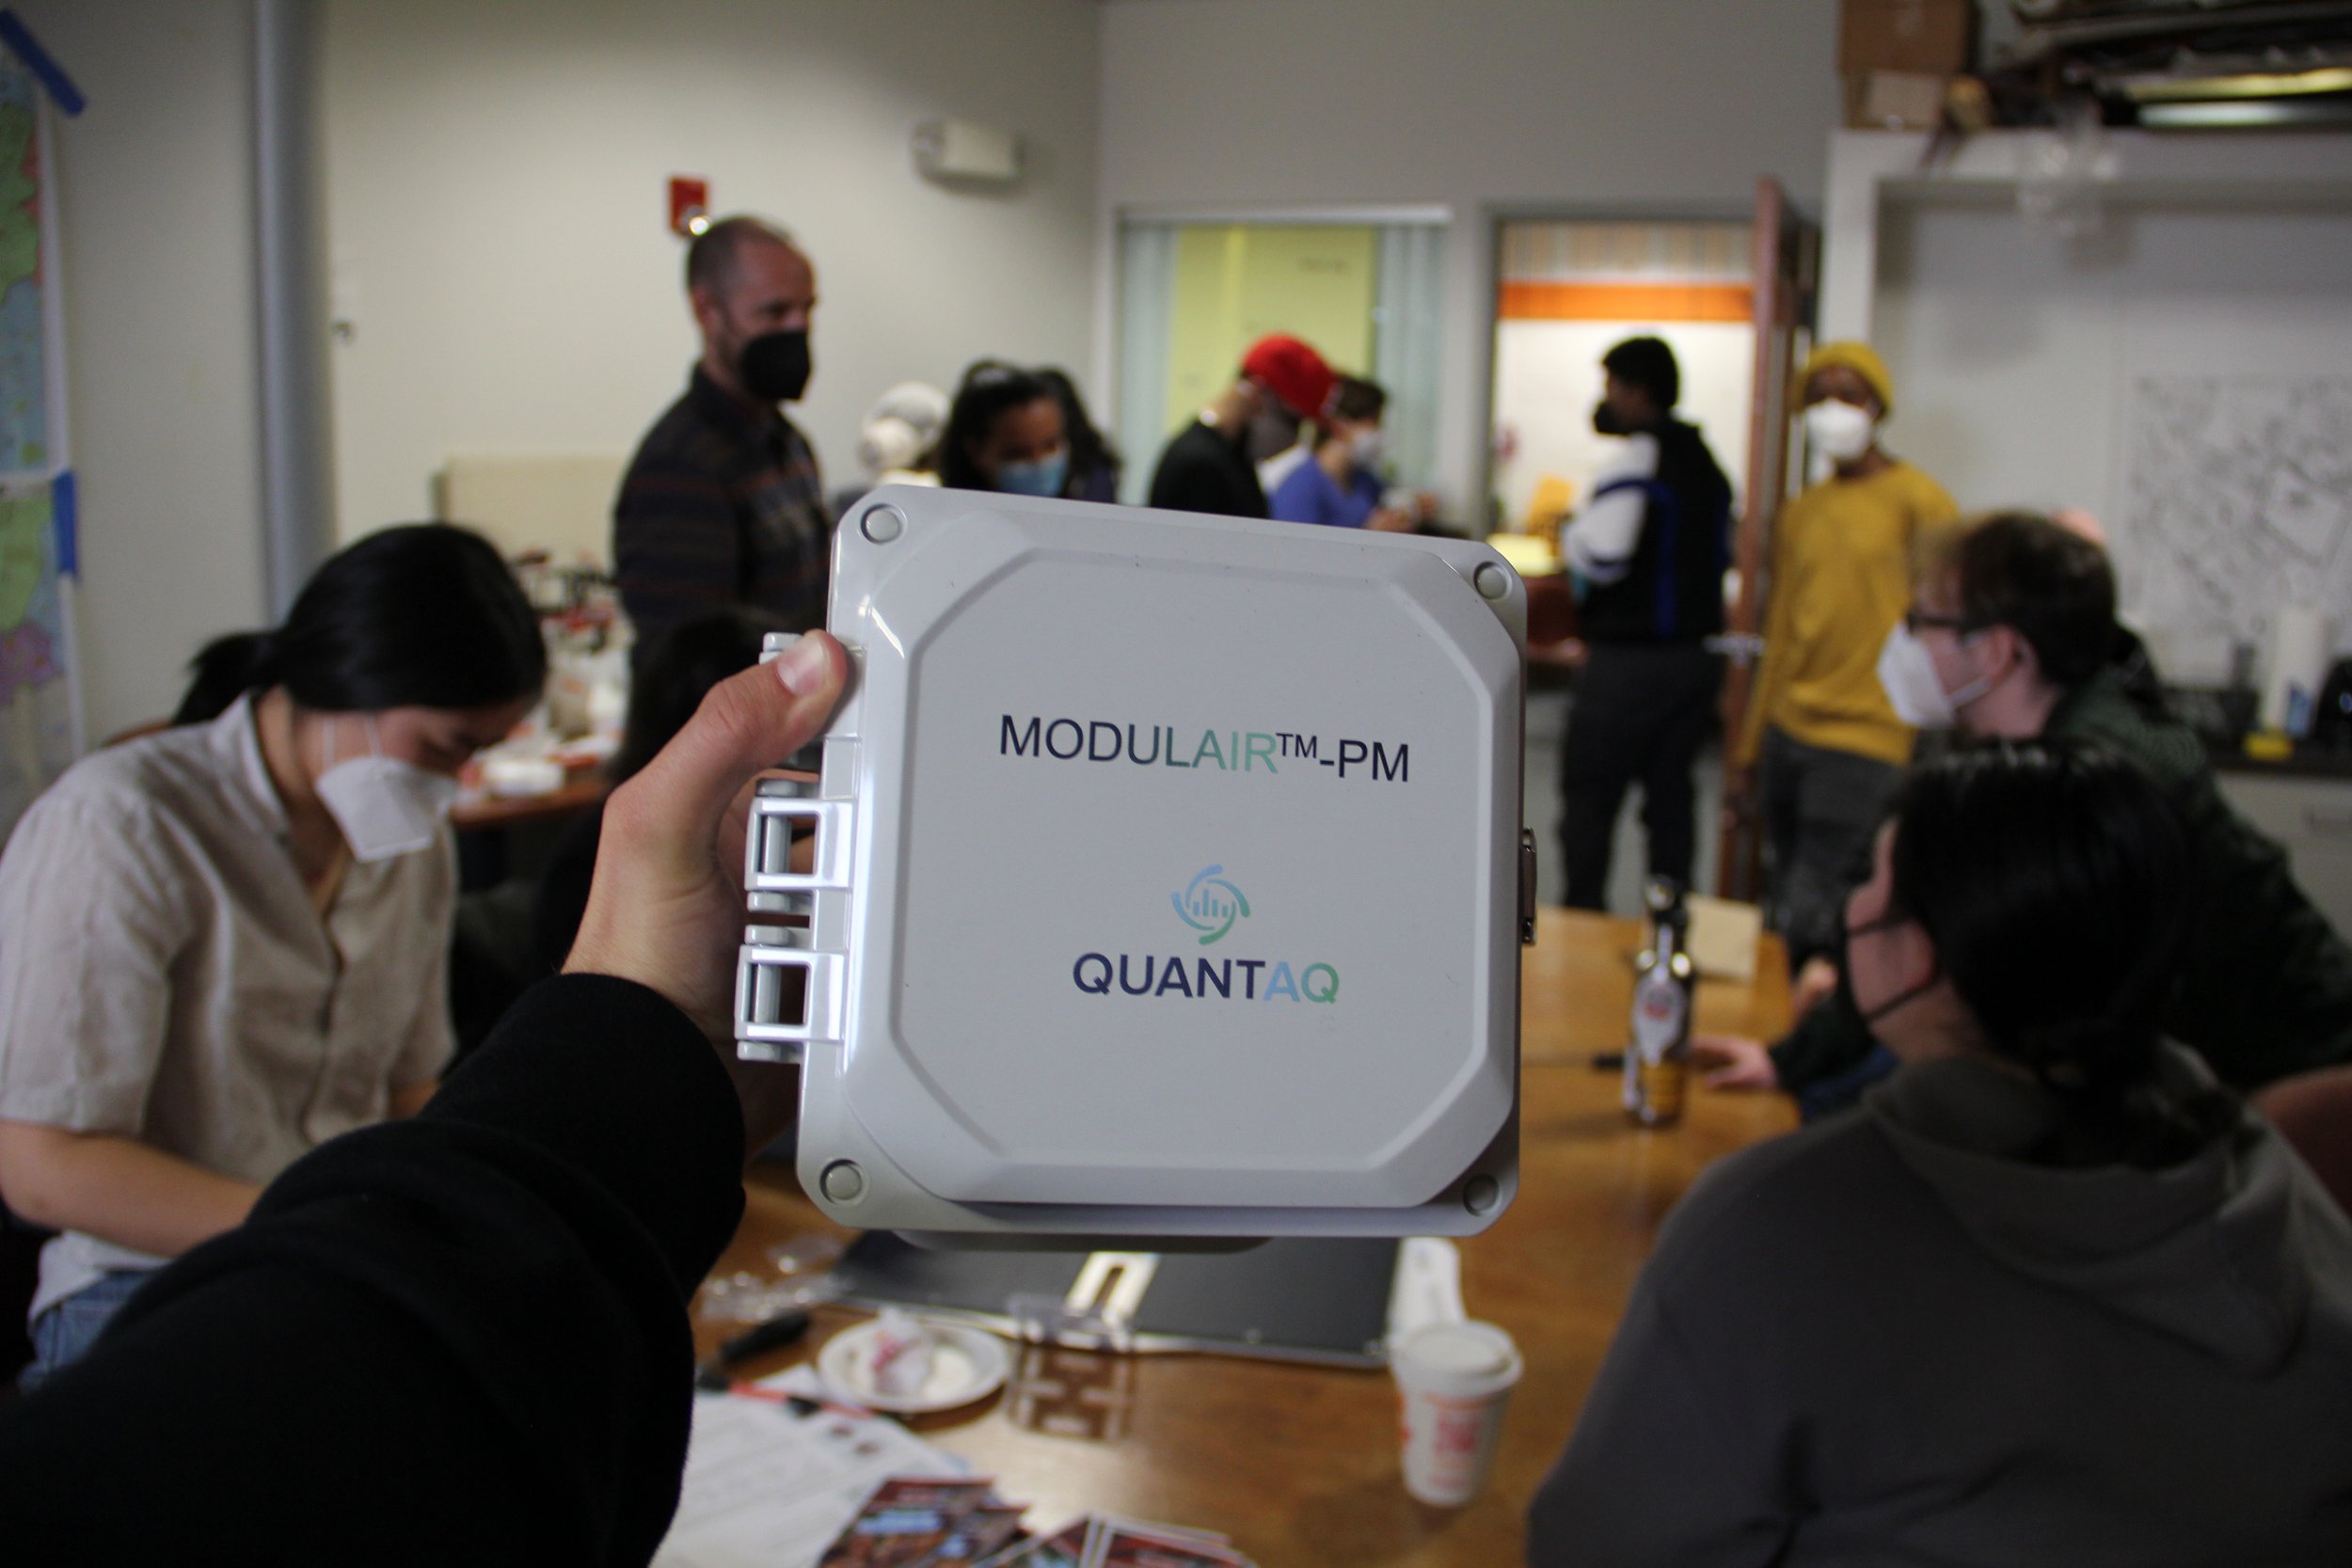
Collect Data

04
Generate Insights

05
Create Artifacts

06
Leverage Artifacts

07
Conclude Projects

 Understand partner expectation